Background/Objectives: India has an estimated 220 million people with hypertension; however, more than 90% are undiagnosed, untreated, or treated but remain uncontrolled. This study evaluated whether comprehensive pharmacist-led intervention improves hypertension outcomes.
Methods: Patients evaluated by a physician for hypertension had blood pressure measured at the outpatient pharmacy. Individuals found to be hypertensive (or reporting consistently higher readings than measured on the visit day) were randomized to a non-intervention or intervention group using a computer-generated block randomization (block size 6). At the pharmacy, the non-intervention group received usual "Medical Shop" service (dispensing with basic dosing instructions). The intervention group received education on hypertension and complications, adherence counseling, and lifestyle modification guidance to support blood pressure control.
Results: Blood pressure control improved progressively in the intervention group after each counseling session. By the fifth visit in Phase 1, 44 patients (48.8%) in the intervention group were normotensive versus 0 (0%) in the non-intervention group. In Phase 2, pharmacist intervention was offered to the Phase 1 non-intervention group; after 6 months, 72.2% were normotensive, 28.8% were pre-hypertensive, and 0% remained hypertensive.
Conclusions: Comprehensive pharmacist intervention substantially improved hypertension control, demonstrating the potential for pharmacists to meaningfully improve healthcare outcomes in Indian patients.
India, Hypertension, Pharmacist intervention, Randomized control
I: Intervention; NI: Non-Intervention; SBP: Systolic Blood Pressure; DBP: Diastolic Blood Pressure; IQR: Interquartile Range; IGH: Indian Guidelines for Hypertension
Globally, the number of people living with hypertension doubled between 1990 and 2019, increasing from 650 million to 1.3 billion [1]. In India, an estimated 28% of adults (> 18 years) have hypertension-approximately 220 million people [2]. Among these individuals, only 12% have adequately controlled blood pressure [3]. In one study conducted in urban slums in India, 24.5% of individuals with hypertension had controlled blood pressure [4], with “controlled hypertension” defined as systolic blood pressure (SBP) < 140 mmHg and diastolic blood pressure (DBP) < 90 mmHg. Overall, approximately 90% of adults with hypertension in India are either undiagnosed, untreated, or treated but not optimally controlled [2]. The Fifth National Family Health Survey (NFHS-5) also reported not only a continued increase in hypertension prevalence in India but an increasing burden among younger adults [5]. Chronic hypertension is a major risk factor for multiple cardiovascular diseases [6], and cardiovascular diseases are now the leading cause of death in India [7].
Indian healthcare faces several challenges, including inadequate resources, insufficient funding, poor healthcare infrastructure, and a substantial rural-urban disparity [8]. Compared with the United States, which has 26.1 physicians per 10,000 people, India has only 7.3 physicians per 10,000 people; when restricted to adequately qualified practitioners, this estimate declines to 5.0 physicians per 10,000 people [9]. In addition to expanding recruitment and training of physicians, India could leverage other well-trained paramedical professionals to help address this major gap in healthcare delivery.
In India, the Doctor of Pharmacy (PharmD) degree was first introduced in 2008. Similar to the United States, it is a six-year program that provides pharmacists with clinical training. However, this educational change was not accompanied by corresponding updates to pharmacist licensure or practice requirements; as a result, even clinically trained pharmacists have not been widely integrated into the provision of pharmaceutical care.
As in the United States three decades ago, awareness remains limited regarding how pharmacists can contribute to improved patient outcomes. The “Asheville studies” were among the first to demonstrate that pharmacist involvement can improve clinical outcomes while reducing healthcare costs in the United States [10]. Evidence from such initiatives has helped support reimbursement models, including Medicare payment for an annual prescription review by a pharmacist.
More recently, pharmacist-led interventions have been associated with improved patient outcomes in developing countries such as South Africa [11] and Pakistan [12]. Such interventions have also demonstrated positive effects on medication adherence in chronic obstructive pulmonary disease (COPD) [13] and on medication error reporting [14]. In India, however, evidence remains limited; aside from the present study, we identified only one smaller randomized controlled trial (RCT) evaluating pharmacist involvement in hypertension management [15].
The study was conducted in the outpatient pharmacy of a tertiary care hospital in Andhra Pradesh, South India, from 1 August 2023 to 30 August 2024.
Patients with established or de novo hypertension who were receiving at least one antihypertensive medication and had uncontrolled blood pressure were invited to participate. Patients who self-identified as having hypertension were also invited.
The sample size was selected based on prior pharmacist-led intervention studies. Similar sample sizes have yielded conclusive results in hypertension [10,11], diabetes [12], and COPD [13].
Adults > 25 years of age of either sex who were being treated for hypertension and provided written informed consent.
Pregnant individuals; children; patients with cancer; patients who were mentally impaired or legally restricted; and patients with renal disorders (acute or chronic kidney disease), pre-eclampsia, or oedema. Patients unwilling to participate were also excluded.
Patients evaluated by a cardiologist for hypertension collected their prescriptions at the outpatient pharmacy. A PharmD intern measured blood pressure using a standardized protocol based on international guidelines under pharmacist supervision. Patients who were hypertensive, as well as those who reported consistently higher blood pressure than the value recorded on the visit day, were invited to participate.
After providing written informed consent, participants were randomized to the non-intervention (NI) or intervention (I) group using computer-generated block randomization (block size = 6). Participants were assigned sequentially as they enrolled, with each block containing three NI and three I participants.
All interns received two months of training (pilot study) from the supervising pharmacist on blood pressure measurement, patient counseling, and study procedures before study initiation. Blood pressure devices were validated for reliability and accuracy during the pilot period. Different groups of PharmD interns participated on a rotating monthly basis.
In the hospital workup room, five PharmD interns greeted and engaged participants and measured blood pressure and heart rate using an Omron HEM 7156 T Digital Blood Pressure Monitor with 360° accuracy Intelli Wrap cuff (all arm sizes), following the International Society of Hypertension Global Hypertension Practice Guidelines. Readings were recorded on visit data-collection charts and, at the end of each day, were cross-verified by the pharmacist by comparing the charted values with those stored in the device memory before data entry into an online Google Form. Typically, one intern measured blood pressure while a second documented the results, and the pharmacist verified and entered the data.
In the non-intervention group, patients received their prescribed medication(s) with simple instructions on dosing frequency. In the intervention group, PharmD interns provided private counseling that included education on lifestyle modifications to improve blood pressure control and on long-term consequences of uncontrolled hypertension. Interns also provided drug monographs and patient information leaflets on hypertension management and added auxiliary labels to dispensed medications, as well as weekly pill organizers; these services are not standard practice in India.
Participants in both groups were followed monthly for the next three months, and blood pressure was measured at each visit for all patients. In the non-intervention group, interns measured and recorded blood pressure and pharmacists dispensed the next month’s supply of medications. In the intervention group, each follow-up visit also included assessment of medication adherence and lifestyle changes, with additional counseling to reinforce blood pressure control. The final Phase 1 visit occurred three months after the fourth visit (i.e., 6 months after study initiation) and included the fifth and final Phase 1 blood pressure measurement. No pharmacist-directed dose adjustments were made during Phase 1.
There was a three-month interval between the fourth and fifth Phase 1 visits. Based on the favorable Phase 1 outcomes in the intervention group, the pharmacist-led intervention was subsequently offered to the Phase 1 non-intervention group. All 90 Phase 1 NI participants agreed to continue and comprised Phase 2; Phase 1 intervention participants were not followed in Phase 2. During Phase 2, the former NI group received the same monthly counseling as the Phase 1 intervention group, with blood pressure measured at 3 months (sixth visit; 9 months after study initiation) and 6 months (seventh visit; 1 year after study initiation). In Phase 2, pharmacist-recommended and physician-approved medication and dose adjustments were made for 49 patients.
Hypertension categories: Based on measured blood pressure, patients were classified as normotensive (NH; SBP < 120 mmHg and DBP < 80 mmHg), pre-hypertensive (PH; SBP ≥ 120 mmHg and SBP < 140 mmHg or DBP ≥ 80 mmHg and DBP < 90 mmHg), or hypertensive (H; SBP ≥ 140 mmHg or DBP ≥ 90 mmHg).
The non-intervention and intervention groups were compared to ascertain that they were not very different from each other at the start of the study. The ages of the participants in the two groups were compared using two-sample t-test and a chi-square test was used to compare the numbers of males and females.
The SBP and DBP values were not normally distributed. Therefore, non-parametric methods were used for comparison of blood pressure values. The median and interquartile ranges are presented as the central tendency throughout the manuscript. The non-intervention and intervention in phase-1 were compared using the two-sample Wilcoxon rank-sum test.
All 180 patients enrolled in the study participated in all their visits and completed the study. There were no dropouts.
Demographic characteristics in the two groups resulting from randomized enrollment is shown in table 1. In the non-intervention group there were 30 females, and 60 males compared to 41 females and 49 males in the intervention group. The average age of the patients in the NI and I groups were comparable 61.3 ± 10.8 and 62.1 ± 10.1 (p = 0.64). The median SBP / DBP blood pressure during the first visit in the non-intervention group was 145 (139,155) / 87 (80,90) and the intervention group was 140 (130,150)/ 80 (80,90). While the SBP and DBP levels in the intervention group were lower, the difference was not statistically significant (P-values comparing SBP and DBP across groups were 0.06 and 0.57, respectively). At the first visit 1.1% of patients in the non-intervention and 3.3% of patients in the intervention group were normotensive with SBP < 120 and DBP < 80.
Figure 1 displays the distribution of patients in each blood pressure category across outpatient visits in the two experimental groups. While the hypertensive distribution of patients in the two groups during the first visit was comparable, there was a remarkable difference in that distribution during the 5th visit - with 0 [0%] patients in the non-intervention group compared to 44 [48.8%] patients in the intervention group achieving normotensive status.
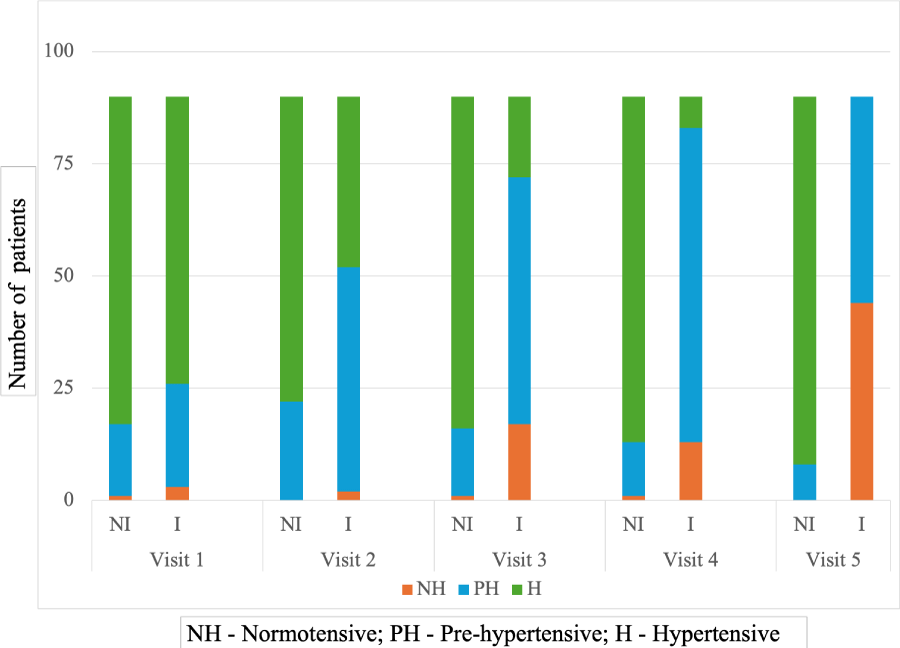 Figure 1: Distribution of hypertensive categories among patients in the Non-intervention [NI] vs Intervention [I] groups during the first five visits.
View Figure 1
Figure 1: Distribution of hypertensive categories among patients in the Non-intervention [NI] vs Intervention [I] groups during the first five visits.
View Figure 1
While patients encountered different group of pharmacy interns (who rotated on a monthly basis) the number of hypertensive patients in the intervention group decreased gradually with a corresponding increase in the number of pre-hypertensives, followed by normotensives. On the other hand, most patients in the non-intervention group continue to be categorized as hypertensive throughout Phase 1 of the study (Figure 1).
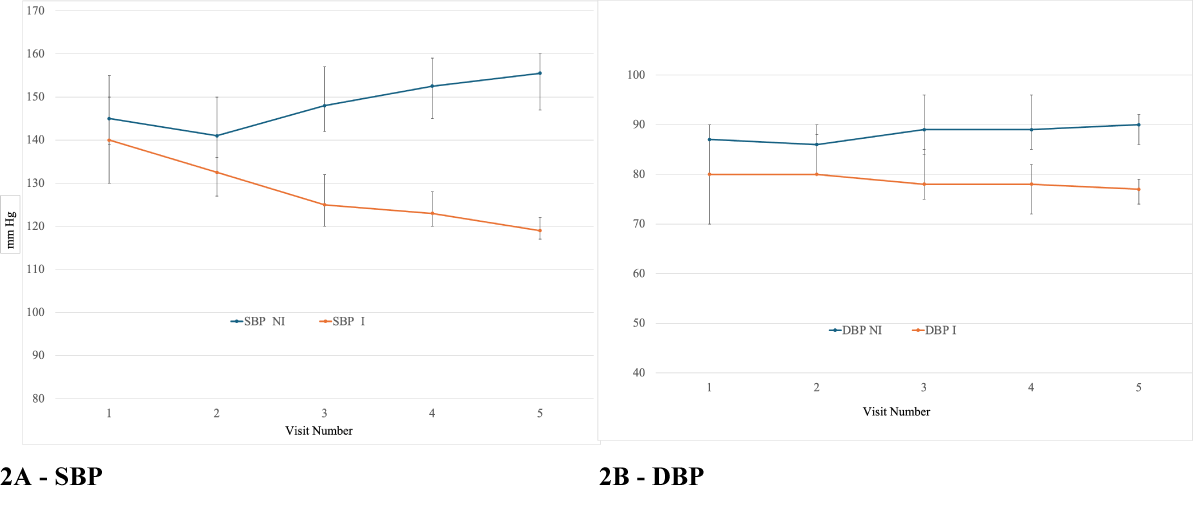 Figure 2: A & B - Median SBP and DBP values in NI and I group during each visit.
View Figure 2
Figure 2: A & B - Median SBP and DBP values in NI and I group during each visit.
View Figure 2
The median drop in SBP and DBP values as shown in figure 2A and figure 2B following pharmacist intervention supports this conversion of hypertensive to normotensive patients following intervention. In the intervention group, SBP and DBP values fell from 140 to 119 and 80 to 77, respectively, between 1 st and 5 th visit. Whereas in the non-intervention group, mean SBP value increased from 145 to 155.5 and DBP from 87 to 90. At the conclusion of the phase 1, the reduction in SBP and DBP in the intervention group, compared to the non-intervention group was highly significant with P < 0.001.
At the start of the 2nd phase of this hypertension project, the pharmacist-intervention was provided to all 90 patients comprising the “non-intervention group” of Phase 1. The SBP (IQR) and DBP (IQR) decreased from 155.5 (147, 160) and 90 (86, 92), respectively during the 5th visit to 126.5 (122, 132) and DBP 81 (78, 83), respectively in the 6th visit - 3 months later, following intern and pharmacist interventions. In phase 2, in addition to all the counseling that was provided in phase 1, 64 pharmacist recommended changes in drug and dosage were accepted by the physician (Table 2).
Table 1: Demographic distribution of patients enrolled in the non-intervention and intervention groups. View Table 1
In Table 2A, 2 nd row indicates the number of patients receiving new prescription of the drug indicated in first row. In Table 2B, row 2 indicates the number of patients whose dosage for the drug in row 1 was increased.
Table 2: Following drug changes were suggested by the pharmacist and approved by the physician in Phase 2. View Table 2
There was a further reduction in the SBP and DBP at the 7th visit, which was the conclusion of the study. At 7th visit, 6 months after initiation of Phase 2, the patients who were formerly in the “Non-intervention” group during Phase 1 had a median SBP (IQR) of 117 (116, 120) and median DBP (IQR) of 77 (76, 78) (Figure 3A and Figure 3B).
 Figure 3A & 3B: Impact on SBP & DBP following pharmacist intervention to the "non-intervention" group in Phase 1 from 5th to 7th visit.
View Figure 3
Figure 3A & 3B: Impact on SBP & DBP following pharmacist intervention to the "non-intervention" group in Phase 1 from 5th to 7th visit.
View Figure 3
In this final visit of Phase 2, 65 patients [72.2%] were normotensive, 25 patients [28.8%] were pre-hypertensive and not a single patient was hypertensive, in contrast to 82 [91.1%] patients being hypertensive at the beginning of Phase 2 [visit 5] (Figure 4).
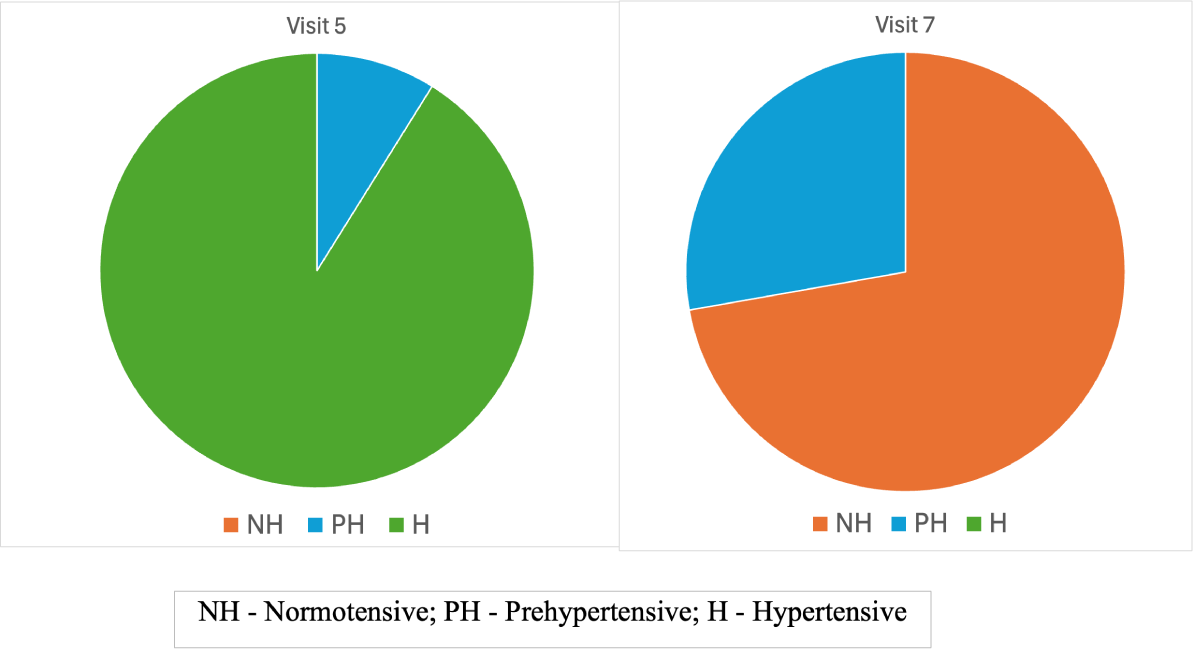 Figure 4: Distribution of hypertension among patients in the phase 2 during 5th and 7th visit, when pharmacist intervention was offered to the original "non-intervention" group of the Phase 2.
View Figure 4
Figure 4: Distribution of hypertension among patients in the phase 2 during 5th and 7th visit, when pharmacist intervention was offered to the original "non-intervention" group of the Phase 2.
View Figure 4
Both Phase 1 and Phase 2 of our study clearly demonstrate the benefits of pharmacist intervention on patient’s blood pressure control in an Indian outpatient setting.
Pharmacists are among the most underutilized healthcare professionals worldwide [16,17]. In many developed countries, efforts have been made to expand pharmacists’ roles in direct patient care. However, in countries such as India - where pharmacists could have an even greater impact because access to other healthcare professionals is limited-recognition of pharmacists as providers of clinical services remains insufficient. The purpose of this investigation was to evaluate the effect of pharmacist-led intervention on hypertension control, one of India’s most pressing public health challenges.
Multiple randomized clinical trials conducted outside India have demonstrated that pharmacist-led interventions can improve hypertension outcomes [18-21]. In the study by Ying Le et al. [18] in China, pharmacist intervention included monthly medication review, patient education, and recommendations to physicians regarding medication adjustments over 6 months. Compared with the non-intervention group, which received basic hypertension education (a service not routinely provided in India), a significantly higher proportion of intervention participants achieved blood pressure control at 6 months (60.7% vs 40.9%, P < 0.01). This higher control rate in the Chinese population may partly reflect the availability of basic education even among non-intervention participants. In our study, the Phase 1 reduction in SBP (21 mmHg) was comparable to the 18.3 mmHg reduction reported in the Alberta/Canada Clinical Trial in Optimizing Hypertension (RxACTION) [21] (2009-2013). Notably, Phase 2 of our study demonstrated a larger SBP reduction (31 mmHg), which may be attributable to a more intensive approach that included pharmacist-recommended, physician-approved medication and dose adjustments (64 recommendations accepted). These findings are consistent with Delage et al. [22], who reported that a single pharmacist-led educational intervention doubled the proportion of patients reaching their therapeutic targets at 3 months.
Additional evidence supports the benefits of pharmacist involvement across diverse settings. In a U.S. veterans population, pharmacist intervention reduced blood pressure by 8/4 mmHg in patients with diabetes and by 14/5 mmHg in patients without diabetes over 6 months, with both reductions statistically significant [23]. A pharmacist-led intervention in community pharmacies in Nigeria improved patient behavior, attitudes, and adherence; however, health status did not change, notably because blood pressure was not measured [24]. Studies from Portugal [25] and France [22] also reported improved outcomes in intervention groups; in the French study, 61.7% of intervention patients reached therapeutic goals compared with 33.3% of non-intervention patients [22]. Similarly, in a randomized trial in Nepal, hospital patients receiving pharmacist intervention demonstrated better outcomes by 4 months across all measured factors, including blood pressure [26].
In India, published evidence remains limited. In a smaller study of 108 patients, only two follow-up interactions were conducted and 28% of participants dropped out; the intervention significantly improved quality-of-life questionnaire scores but did not significantly change blood pressure compared with the non-intervention group [15]. Nonetheless, the importance of clinical pharmacist intervention has been highlighted in India; for example, a report from Moga described 628 pharmacist interventions over five years [27]. Few randomized controlled trials in India have evaluated hypertension management approaches that do not involve medications or pharmacists. In one small trial (n=40), participants randomized to control or home-based isometric handgrip (IHG) training demonstrated significant reductions in blood pressure and pulse rate after 8 weeks in the IHG group [28].
Another randomized controlled study evaluating non-pharmacological interventions - including physical exercise, dietary salt reduction, and yoga-reported significant blood pressure reductions across interventions (5.3/6.0; 2.5/2.0; and 2.3/2.4 mmHg, respectively) [29]. Because participants in our intervention group received counseling on lifestyle modifications (including exercise and the DASH diet), these factors may also have contributed to the improvements observed in our study.
Even in countries with more advanced healthcare systems, blood pressure control remains suboptimal; in the United States, only about 25% of patients with hypertension have fully controlled blood pressure. Dixon et al. [30] evaluated the cost-effectiveness of pharmacist intervention based on the Alberta Clinical Trial in Optimizing Hypertension (RxACTION)[21] and estimated that 50% uptake of pharmacist prescribing could improve blood pressure control, saving $1.137 trillion and adding an estimated 30.2 million life-years over 30 years. Schultz et al. [31] similarly reported that medication therapy management for hypertension was cost-effective (incremental cost-effectiveness ratio of $38,798 per quality-adjusted life-year gained) and concluded that current reimbursement for pharmacist services is inadequate.
The Indian Guidelines for Hypertension (IGH-IV) recommend two blood pressure targets based on age: 120-130/70-80 mmHg for patients < 65 years and < 140/90 mmHg for patients ≥ 65 years [32]. Based on global burden of disease estimates, India’s cardiovascular disease (CVD) death rate (272 per 100,000 population) exceeds the global average (235 per 100,000) [6], and CVD deaths occur at younger ages in India than in Western countries [33]. A meta-analysis of 123 studies including 612,815 patients found that each 10 mmHg reduction in SBP significantly reduces cardiovascular risk and is associated with a 13% reduction in all-cause mortality [34]. Accordingly, whenever feasible, achieving tighter blood pressure control may meaningfully improve outcomes for Indian patients.
Although non-communicable conditions such as CVD are clearly major public health problems in India [7], relatively limited progress has been made to address them at scale [35]. Our findings suggest that clinically trained pharmacists-graduating from more than 200 pharmacy colleges in India-could be effectively integrated into multidisciplinary healthcare teams. Broader integration of pharmacists into chronic disease management may represent a highly impactful and cost-effective strategy to improve CVD outcomes in India.
Study limitations: This study was conducted in a hospital outpatient setting. Receipt of a Fulbright grant facilitated implementation of the project and prompted the hospital to allocate a separate room for the research activities. In addition, the co-PI (Satheesh Gottipati) provided guidance and supported recruitment of PharmD interns to deliver the pharmacy services at no cost. These enabling factors may not be readily reproducible in typical community settings in India under current practice conditions. Nonetheless, we hope these findings motivate other institutions to implement and evaluate similar pharmacist-led services within their communities.
Our findings demonstrate that pharmacist-led intervention can improve blood pressure control among patients with hypertension in an Indian outpatient setting, consistent with evidence from other regions reporting similar benefits.
An abstract from Phase 1 was presented at the 82nd FIP conference (Cape Town, South Africa; September 2024). An abstract from Phase 2 was presented at the APhA Annual Meeting (Nashville, TN; March 2025).
Ethical approval was obtained from the University of Findlay (Protocol No. 1678) and the Indian Hospital Institutional Ethics Committee (ECR/81/INST/AP/2013/RR/2019).
Written informed consent was obtained from all participants involved in the study.
This work was supported by the Fulbright-Nehru award to Dr. Sekar.
The data presented in this publication are available from M. Chandra Sekar upon reasonable request by email (sekar@findlay.edu). Please specify the purpose for which the requested data will be used.
We thank the University of Findlay and Aster Ramesh Hospitals for supporting this project, the Vignan Pharmacy College interns for data collection, and Padmini Sekar for statistical support.
The authors declare no conflict of interest.